
Marketing (and especially digital marketing) is part art and part science. The “art” is creative – writing content, creating imaginary like graphics and videos, and building UX platforms that your audience likes. The “science” is collecting and tracking everything… clicks, views, likes, retweets, shares, comments, etc all defined as user engagement or metrics. Without collecting and analyzing data, you’ll never know if the creative efforts are working.
The primary tool for tracking user engagement on Facebook is called Insights and it’s powerful… When using Facebook Insights, you’ll be able to determine the best time of day to post, the best day of the week to post and what type of content is most popular. And Facebook Insights tool is constantly updated with new data to reflect your page’s developments and any patterns that may form, so you’ll need to keep checking back to keep in the loop.
https://youtu.be/3KVT0qPid8Q
Here are some useful steps to Facebook Insights:
1. Accessing Facebook Insights
Access your Fan Page and click on the “Insights” tab above your header image and you’ll access a graph like the one below.
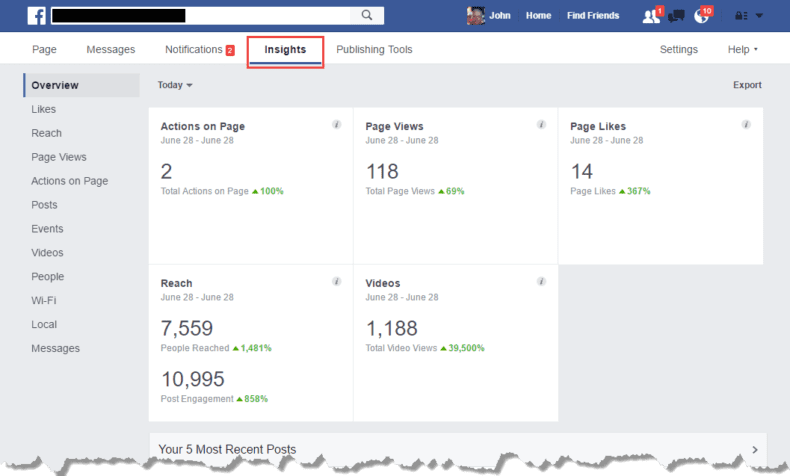
This is the Insights dashboard. As you see, data is broken into five tabs. Let’s go through each tab and explain what they do.
Facebook Metrics:
- Actions on Page – The number of clicks on your Page’s contact info and call-to-action buttons.
- People – This is your audience and how they are accessing your page.
- Page Views – The number of times people viewed your Page and it’s sections.
- Page Likes – The number of times people liked your page.
- Reach – The number of people your posts have reached plus likes, comments and shares and more.
- Messages – The percentage of messages you’ve answered and your average response time.
- Videos – The number of times the videos on your Page have been viewed (for at least 3 seconds).
2. Facebook Likes
This is where you can drill down to view your Facebook Page statuses in relation to the fans on your page.
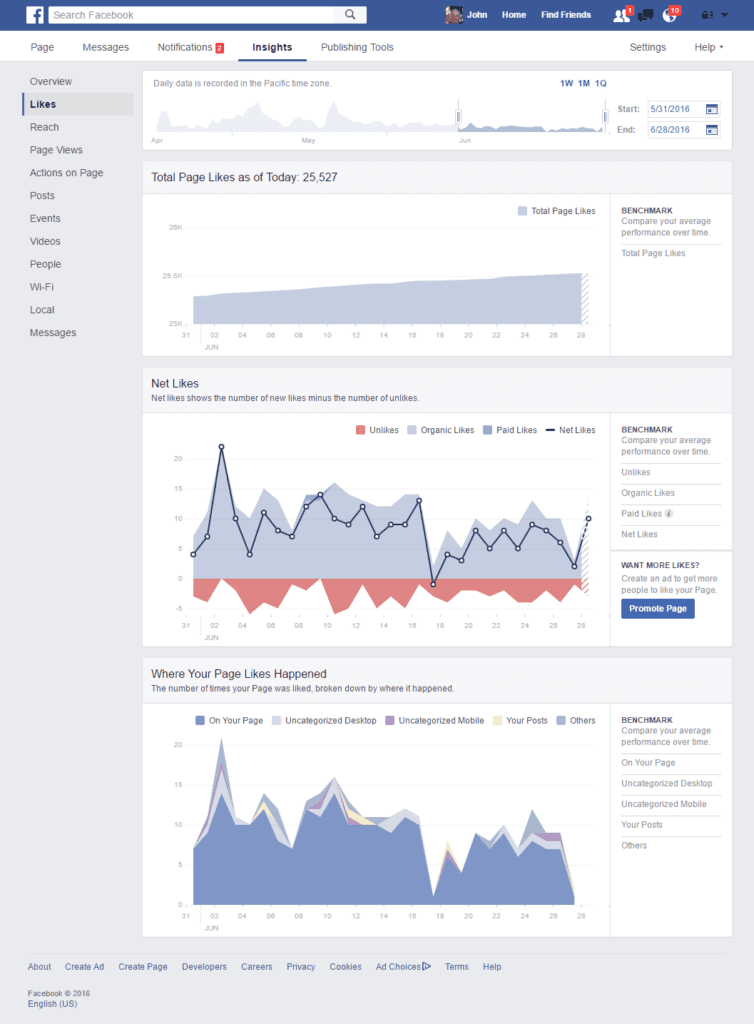
- Total Page Likes – View the growth or decline of your ‘likes’ over a weekly basis.
- Net Likes – This shows you the likes that were organic (unpaid) and those that were paid, through Facebook ads. You’ll also see if anyone has ‘unliked’ your Page. There’s nothing wrong with getting some ‘unlikes’, as long as it’s a very small percentage of your total audience.
- Where Your Page Likes Happened – The majority of likes will probably happen when people visit your Facebook Page but they could happen in other places.
- For example, there is a feature where Facebook will recommend other Pages to like, when someone likes a Page. Your Page could be in this recommended list, as long as you have this option enabled under Settings -> General -> Similar Page Suggestions:
Use this section to analyze when you get most and/or the least likes. Was it because of a promotion? Great content, etc?
3. Facebook Reach Analytics
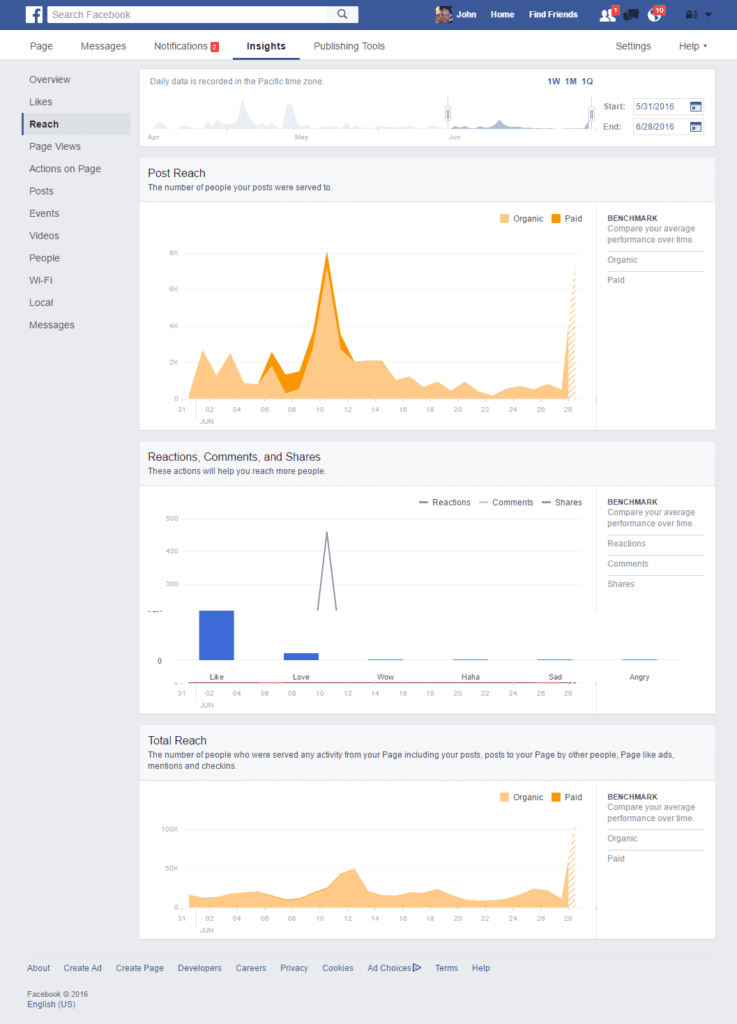
- Post Reach – This shows you the number of unique people who see your postings on Facebook over a period of time. This is split into organic and paid methods. If you click on any section of the graph, Facebook Insights will show you details of the posts that day that created the reach displayed.
- Reactions, Comments, and Shares – View the trends related to likes, comments and shares on posts. Click on any point in the graph and view the posts related to those trends.
- Reactions – Reactions are a new feature for Facebook’s ubiquitous “Like” button that allows you to respond to posts with one of 6 emoji: Like, Love, Haha, Wow, Sad and Angry.
- Hide, Report as Spam and Unlikes – Unlikes are ok as long as it’s only a very small percentage of your total fan count. However, people marking your content as spam is something you really need to watch. This is not a big issue if it’s only the odd time but, if it’s happening regularly, you may be penalized by Facebook for it.
- Total Reach – This shows you your post reach, plus any content that that was posted to your Page and shown to your fans, Page-like ads displayed to people, mentions and checkins.Remember: Reach is the number of unique people that see your content.
4. Facebook Page Analytics
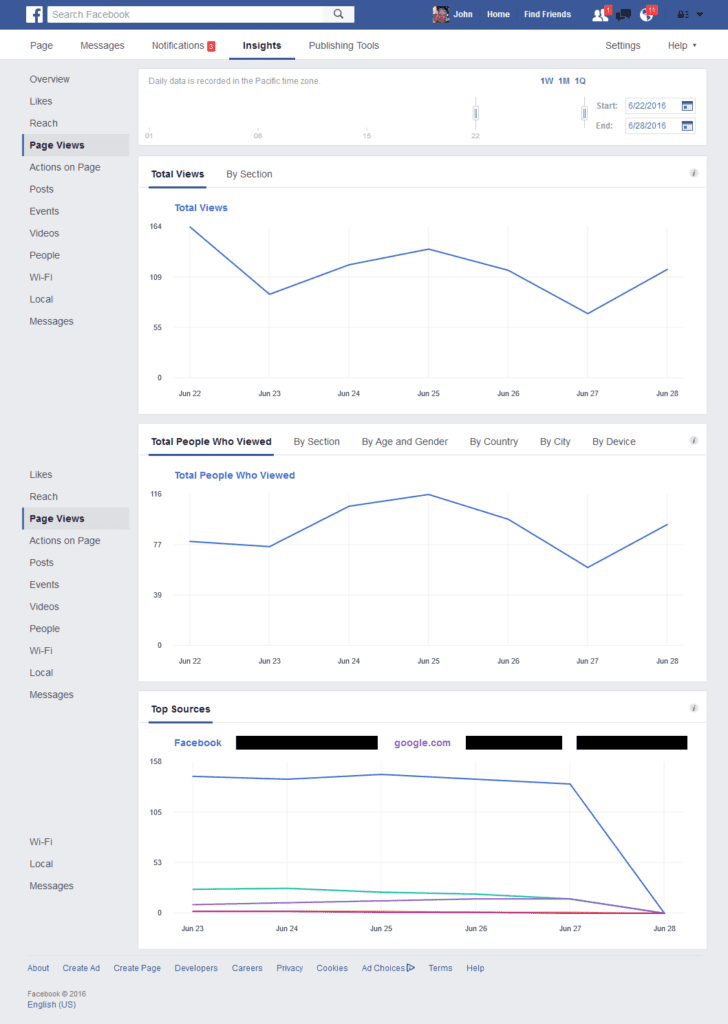
- Total Views and Total People – These charts show you the number of times your Facebook Page – and any tabs on your page – are visited. If you click into the inner-tabs you can get more specific data like age, gender, location and device.
- Typically, fans don’t revisit your page once they become a fan. You are relying on them seeing information in their newsfeed.
- If you build an application on your Facebook Page (e.g. a competition), very few people will visit it unless you post about it and share a link.
- Top Sources – These are external referrers (other websites) that have directed traffic to your page.
5. Facebook Posts Analytics
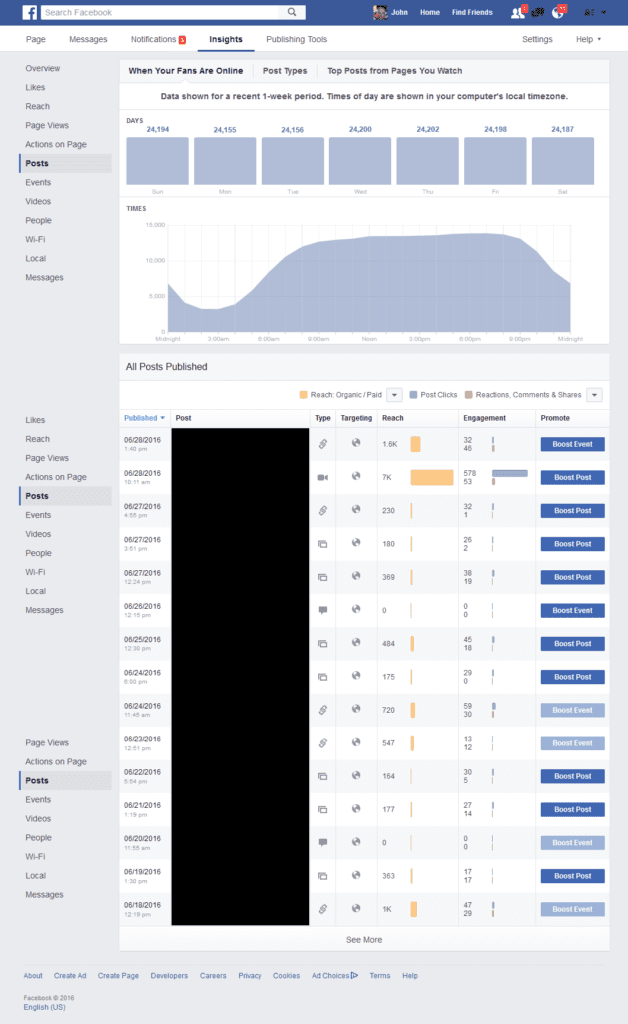
This section is split into three sections:
- When Your Fans Are Online – This shows you how many of your fans are online at any given time during the day. In the graph below, most of our fans are on Facebook later in the afternoon, which makes sense as a lot of our fans are based in the US and we’re at least 5 hours ahead of them.
- It’s not always best to post when most of your fans are online, because that may also be the most competitive time to get onto their newsfeed. You also may have fans in different parts of the world, so you will need to target them with content at different times.
- Post Types – View a list of the posts you shared on your Page by type. You can see which posts worked the best – photos, links or status updates. You should always have a variety of updates on your page, so try to have a good mix.
- Top Posts From Pages You Watch – This will show you the most popular posts from Pages you track. It is really useful to see which posts work well for your competitors.
6. Facebook People Analytics
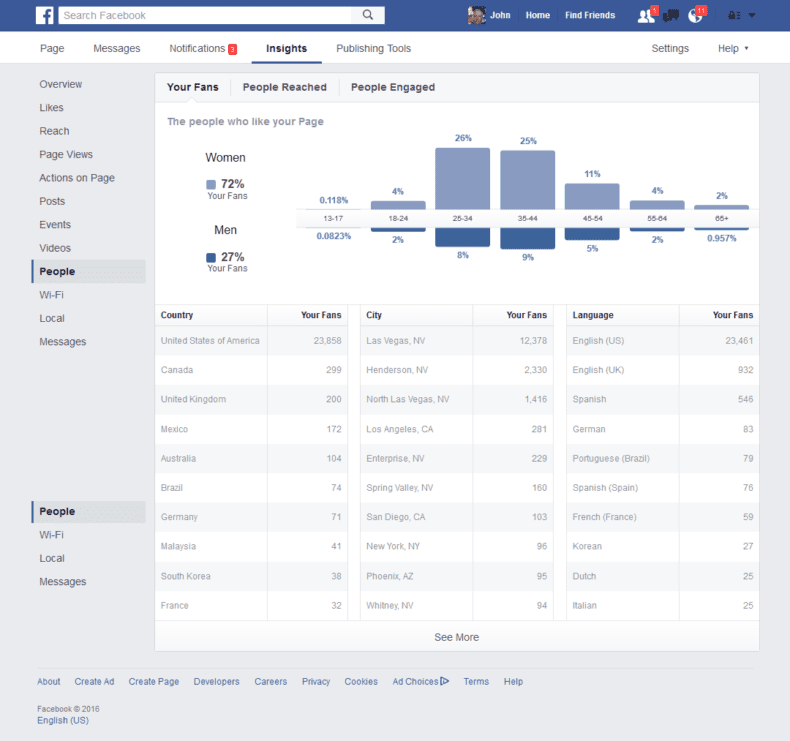
This is section split into the following:
- Your Fans – This shows you a breakdown of the demographics of your fans – male/female, country, city, language etc.
- People Reached – This shows you a breakdown by country, city and language, based on the people who have seen your status updates. Analyze this to see if you are reaching the people you really want to target.
- People Engaged – View a breakdown of people who have engaged with your content based on country, city and language.
7. Exporting Data
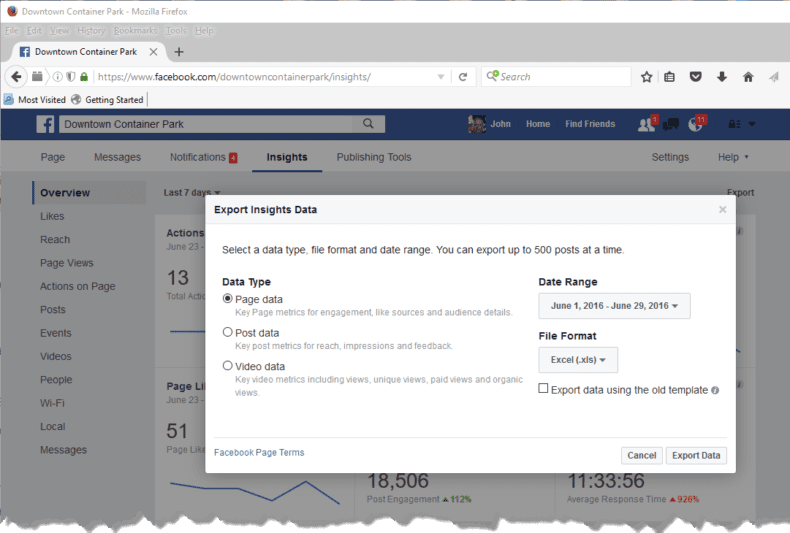
You can export data on your Facebook Page into .xls (Excel), .csv (comma separated) files for further analysis.
- Page data – This gives you rows of a daily breakdown, over a period of month, of data such as new likes, unlikes, engagements, total reach etc.
- Post data – This gives you a daily breakdown of data related to specific posts
- Video data – A breakdown of daily views, unique views, organic/paid views.
When exported Insights data, it’s in a format that enables you to produce your own customized reports. You could easily create some Excel macros that would automatically take this data and produce professional reports that could be used for presentations to managers, customers, etc..