There’s more to successful advertising than matching your campaign with searcher’s intent.
It’s hard to measure “intent,” but digital advertising does give advertisers (and marketers) the ability to leverage user data to get closer than ever to matching their promotion with the people who need and/or want it most.
I don’t think there is another platform that can do this better than Google Ads.
Yes, Facebook Ads can match (and exceed) Google when it comes to the amount of user data they have to monetize, but Google still holds the holy grail – search query.
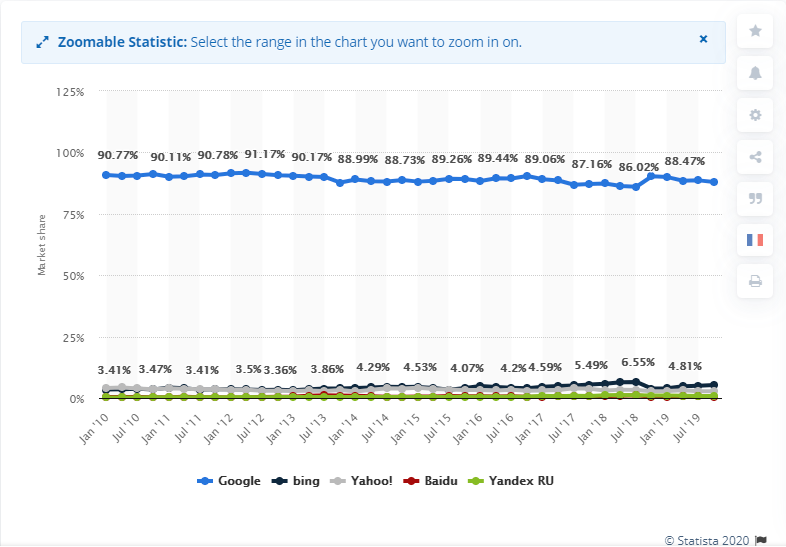
Not only does Google own search query data, they are also the most-used advertising platform of any of the platforms – Google Ads, Facebook Ads, Bing Ads, LinkedIn Ads, and Twitter Ads.
If you’re going to manage PPC campaigns, why not tap into this huge amount of data?
Whether your manually managing ads or utilizing automation, ads must be monitored, evaluated, and analyzed on a regular basis. So the million dollar question, of the hundreds of marketing metrics to look at, which are most important?
Here’s the short list of metrics to track that most PPC experts consider the most important:
Return on Advertising Spend (ROAS)
Cost per Acquisition (aka Conversion) (CPA)
Conversion Rate
Clickthrough Rate (CTR)
Cost per Click (CPC)
Impression Share
Quality Score
Most of these metrics are crucial for any pay-per-click campaign – whether social media marketing (like Facebook ads) or search engine marketing.
Metrics Explained
Return on Advertising Spend
Return on advertising spend, or ROAS for short, is exactly as it sounds: how much money are you getting back from your advertising. ROAS is the ultimate metric for any ad campaign… When the boss asks, “How are the ads doing?” – this is your go-to metric.
How to Find it?
ROAS = Revenue / Ad Spend x 100
For example, if you spend $10 on an ad and it drove $100 in revenue, your formula would look like this:
ROAS = $100 / $10 x 100 = 1,000%
In order to find a true ROAS number, you need to keep track of your deals and sales and track where these customers / leads came from.
Google offers “target ROAS” bidding as part of their Google Ads Smart Bidding strategy. This feature helps you get more conversion value or revenue at the target return-on-ad-spend (ROAS) you set. Your bids are automatically optimized at auction-time, allowing you to tailor bids for each auction.
Target ROAS is available as either a standard strategy for a single campaign or a portfolio strategy across multiple campaigns. This article explains how Target ROAS bidding works and what its settings are.
Google requires you to have at least 20 conversions in the last 45 days; additionally, they recommend that there are at least 50 conversions in the last 30 days in order to use this as a bidding strategy.
Benchmark
Positive numbers are good.
The best benchmark would be to compare your return on ads to the return you see on other channels. If it’s much lower, it either means your account needs some help or it’s not the best channel for you. Alternatively, if you see much higher returns on ads, keep investing!
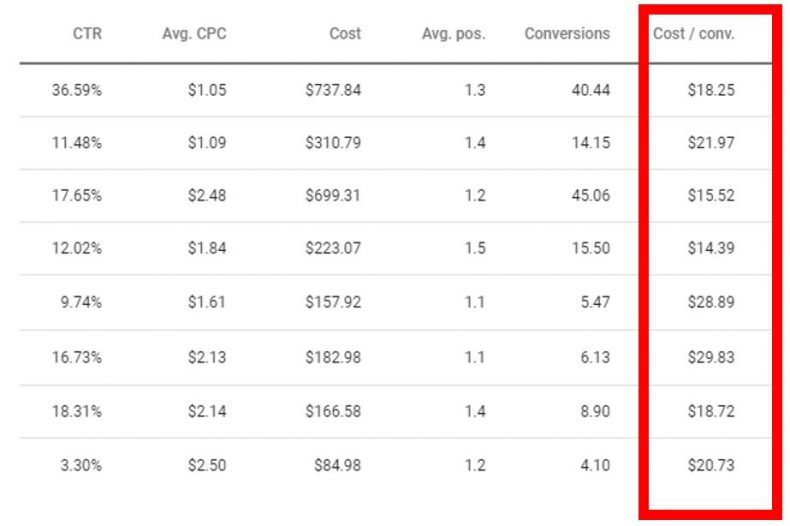
Cost per Acquisition (aka Conversion)
Cost per acquisition, or CPA for short, is the amount you’re spending on each desired action taken.
This might be the most important metric for an individual ad campaign… Whether your conversion is a purchase, a form submission, or an email signup, cost per conversion tells you how much you’re paying for that desired action. When we’re talking about pay-per-click campaigns, this metric is vital.
CPCs are a key metric to look at when determining your optimum budget if you have a specific conversion goal in mind.
How to Find it?
CPA = Total Cost of Conversions / Total Number of Conversions
Let’s say your average click costs around $1.00, your average conversion rate is 2%, and you want to get around 20 sales per month. Your monthly budget should be $1,000 (1000 clicks x 2% conversion rate = 20 sales and 1,000 clicks x $1 = $1,000)
Benchmark
Don’t buy the general benchmark data you might find from other resources. Every campaign has different conversion goals.
For instance, look at these two scenarios:
- Company A runs Google ads leading users to a landing page where the ask is an email signup. Their cost per conversion is $50.
- Company B runs Google ads taking users to a landing page where the ask is to buy a $500 product. Their cost per conversion is $250.
Company A has a lower cost per conversion, but Company B is probably seeing a $250 ROI on this campaign. A better benchmark may be to compare your cost per conversion in ads to other marketing channels. It may cost $50 to get an email address with ads, but it may cost $1000 to send someone to a trade show where they collect 15.
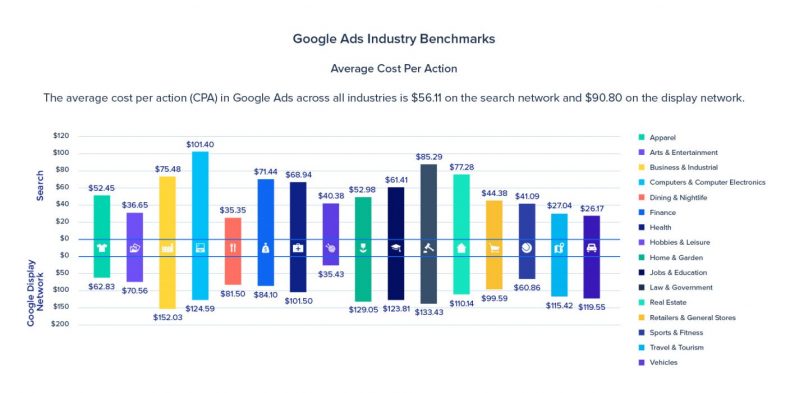
CPA Benchmark Averages by Industry
Conversion Rate
Conversion rate is the rate at which users are taking the desired action post-click. Conversions are what most advertisers are after, either in the form of leads or sales and conversion rates give you a good insight into your best-performing ad copy, keywords, and landing pages. This metric should tell you a handful of things:
- If your landing pages optimized
- If you’re using the right keywords
- If you’re targeting the right people
Most people jump the gun if conversion rate is low and consider the landing page. But what might actually be happening is poor keywords or targeting. Make sure you’re going after the people and utilizing negative keywords to keep irrelevant clicks from getting through.
Keep in mind that there’s no solid benchmark for conversion rates across industries; they can vary greatly from advertiser to advertiser and a conversion rate does not tell you how qualified the conversion was.
How to Find it?
Conversion Rate = (Conversions / Total Visitors) * 100%
For example, if your site had 17,492 visitors and 2,305 conversions last month, your conversion rate is 13.18%. Easy enough, right? In fact, if you set up your tracking right, most online advertising (eg, AdWords, Facebook Ads) and analytics platforms (eg, Google Analytics) can actually show you your conversion rate right in their interface.
When it comes to conversions and conversion rates, much like the other metrics, trends are the star of the show. Keep in mind that a change in conversion rate can be as simple as seasonality or as complex as a changing business landscape within your industry.
Benchmark
Conventional thinking says a good conversion rate is between 2% and 5%. However, as mentioned, conversions mean different things to different businesses. A conversion rate on a page asking for an email address will probably be higher than a page asking for a $1,000 donation.
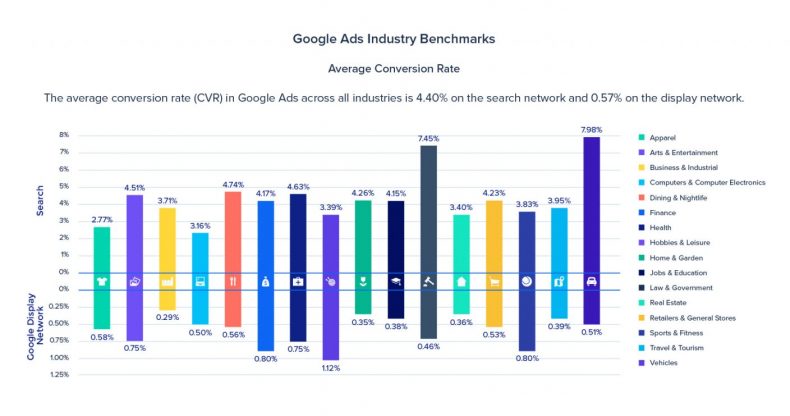
Conversion Benchmark Averages by Industry
Clickthrough Rate
Click-Through Rate, or CTR for chort, is a ratio of how often your ads are shown versus how often your ads are clicked on (i.e. clicks/impressions).
How to Find it?
Clicks / Impressions = CTR
If your ads were shown 1,000 times and clicked on 500 times, your CTR would be 50%.
It’s an important metric to keep an eye on, but as usual, isn’t so straightforward. You want a high CTR, but when it comes to Google Ads, you only pay for clicks. So if you use language in your ads that weeds out unqualified clicks, you may see a lower CTR.
Example
- Company A runs a campaign seeking to increase shoe sales with direct, straightforward ads. They target “blue shoes with green laces” keywords and have a page optimized for blue shoes with green laces.
- Company B runs a campaign seeking to infiltrate a market with a new product. They target “beef jerky” keywords, but are selling a beef jerky alternative: bacon jerky.
Company A is running a predictable campaign whereas the other is trying to infiltrate a new market and put their ad in front of someone who may not have been necessarily looking for it. So it’s okay if CTR isn’t sky high.
However, if an ad’s CTR gets too low, its quality score could be affected, so you do want to keep eyes on this and make sure your ads are still relevant to the targeted keywords.
Benchmark
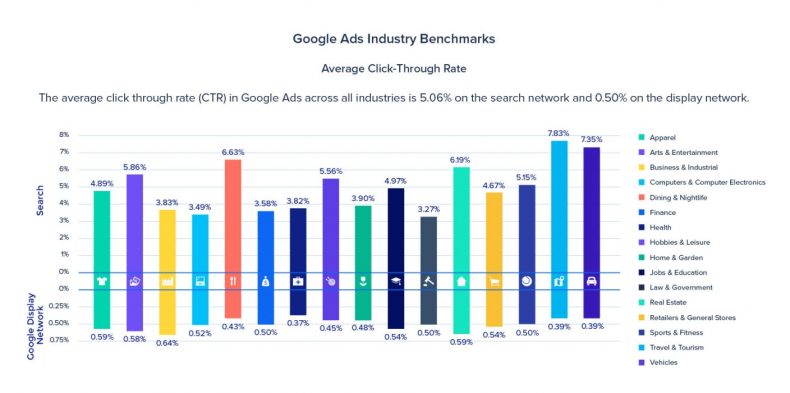
Wordstream has a great resource on average CTR’s by industry. In general, somewhere between 4% and 8% is solid.
CTR Benchmark Averages by Industry
Cost per Click
Cost per click, or CPC for short, is how much you pay per click (pretty self-explanatory). This is an interesting metric though, because many think there’s not much one could do to change this. However, well-optimized campaigns should lead to a declining CPC over time.
How to Find it?
CPC = Money Spent / Total Number of Clicks
Let’s say that you spent $80 on clicks and got two sales—your resulting Cost per Conversion would be $40. This would be a high Cost per Conversion if you’re selling t-shirts (where the average order might be $20), but a low Cost per Conversion if you’re selling warehouse shelving (where the average order might be $2,000).
Benchmark
The same resource from Wordstream has average CPC by industry. This is a good benchmark, but again, keep an eye on trends over time.
CPC Benchmark Averages by Industry

Impression Share
Impression share tells you how often your ads are showing compared to how often they could have been shown. If your ad isn’t showing, it’s due to rank (Google is prioritizing ads it thinks searchers will be more likely to click) or budget (yours is limited). You want your ad to show in every possible situation.
Impression share is really helpful to know, but what might be even more helpful is to know why an ad didn’t show. If due to rank, you need to address that ASAP. If due to budget, this means there’s opportunity.
How to Find it?
Impression Share = Impressions / Impression Opportunity
For example, if 1,000 searches were done in a day for a keyword of yours, and your ads were shown 800 times for that keyword, you would have an 80% impression share. Conversely, you would have a 20% lost impression share, since you’re missing out on 20% of the available impressions.
You can find Impression Share, Lost Impression Share Due to Budget, and Lost Impression Share Due to Rank by adding them to columns for view within the Google Ads dashboard.
Benchmark
If your impression share is lower than 70-80%, you should look to where you’re losing out. If due to budget, there’s not much of a benchmark. Sometimes our resources are just limited. A Lost Impression Share Due to Rank of 20-30% is pretty high and needs to be addressed.